Mapping floods from space, and what they hit
IIB Board AI Pack, page 28. Second phase. Built here on mock and synthetic data.
Today. When a flood or cyclone strikes, the extent of the damage can take days to become clear. IRDAI asks insurers to fast-track claims, and the first question is what is insured where.
What would change. AI reads free satellite radar images, which see through cloud, and maps the flooded area within days. Laid over insured locations, it estimates the property and vehicles affected, then tracks claims against that estimate.
Inside the flooded area in Assam, there are 374 insured properties with a total sum insured of ₹1,747 cr. The largest values are for factories at ₹877 cr, warehouses at ₹416 cr, hospitals at ₹163 cr, and hotels at ₹156 cr. Houses are the most common type, with 150 policies and a sum insured of ₹52.3 cr. There are 873 vehicles in the flooded area, with an insured value of ₹32.1 cr, and 542 of these have cover for flood damage. The first estimate of the total loss is ₹99.5 cr. As at 4 October 2026, 102 flood claims have been reported, amounting to ₹57.5 cr. Insurer E has the most value in the flooded area, with 27 policies and a sum insured of ₹201 cr.
Written by the AI (Azure OpenAI), saved from an earlier call for these same figures, and checked: every number in it comes from the figures, and it keeps the house style.
What the writer was given
The same figures as the page, in this role's labels. No policy, person or address.
{
 "question": "How much insured property sits inside the area flooded this week?",
 "flood": {
  "where": "Assam",
  "state": "Assam",
  "began": "21 September 2026",
  "radar_image_taken": "26 September 2026",
  "flooded_area_km2": 1641,
  "image_kind": "mock radar scene"
 },
 "insured_property": {
  "policies": 374,
  "sum_insured_text": "₹1,747 cr",
  "by_type_largest_value_first": [
   {
    "type": "factories",
    "policies": 43,
    "sum_insured_text": "₹877 cr"
   },
   {
    "type": "warehouses",
    "policies": 46,
    "sum_insured_text": "₹416 cr"
   },
   {
    "type": "hospitals",
    "policies": 17,
    "sum_insured_text": "₹163 cr"
   },
   {
    "type": "hotels",
    "policies": 21,
    "sum_insured_text": "₹156 cr"
   }
  ],
  "most_common_type": {
   "type": "houses",
   "policies": 150,
   "sum_insured_text": "₹52.3 cr"
  }
 },
 "vehicles": {
  "vehicles_in_flooded_area": 873,
  "insured_value_of_all_those_vehicles_text": "₹32.1 cr",
  "how_many_of_them_have_cover_for_flood_damage": 542,
  "how_placed": "Motor policies carry only the RTO, so each vehicle is placed near its RTO's home district centre."
 },
 "insurers": {
  "insurers_with_property_inside": 25,
  "largest_by_sum_insured": [
   {
    "insurer": "Insurer E",
    "policies": 27,
    "sum_insured_text": "₹201 cr"
   },
   {
    "insurer": "Insurer L",
    "policies": 42,
    "sum_insured_text": "₹157 cr"
   },
   {
    "insurer": "Insurer Q",
    "policies": 24,
    "sum_insured_text": "₹147 cr"
   }
  ]
 },
 "expected_loss": {
  "total_text": "₹99.5 cr",
  "property_text": "₹98.6 cr",
  "vehicles_text": "₹88.9 lakh",
  "property_claims_expected": 156,
  "basis": "assumed claim chances and damage shares, so a first estimate"
 },
 "claims_so_far": {
  "as_at": "4 October 2026",
  "claims": 102,
  "amount_text": "₹57.5 cr",
  "share_of_property_estimate_pct": 58
 }
}What the satellite saw
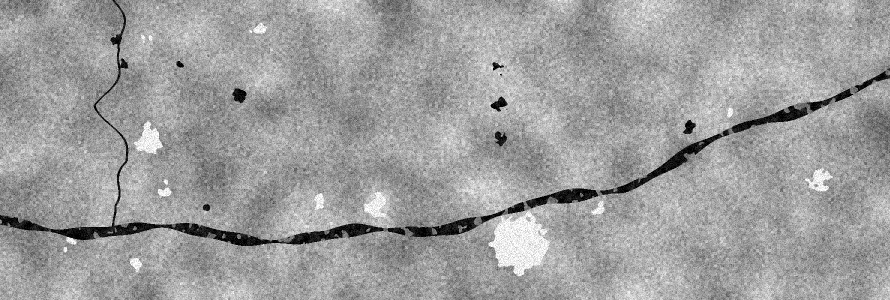
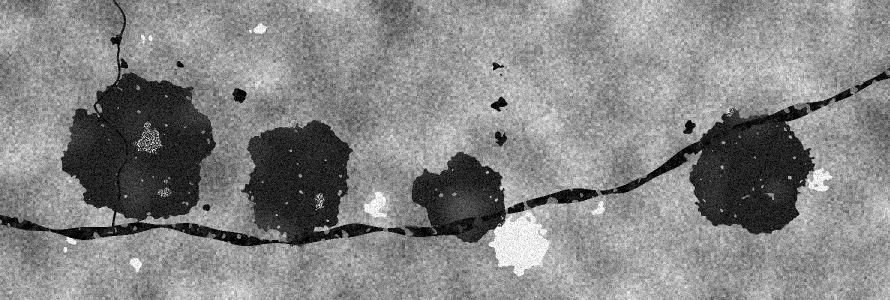
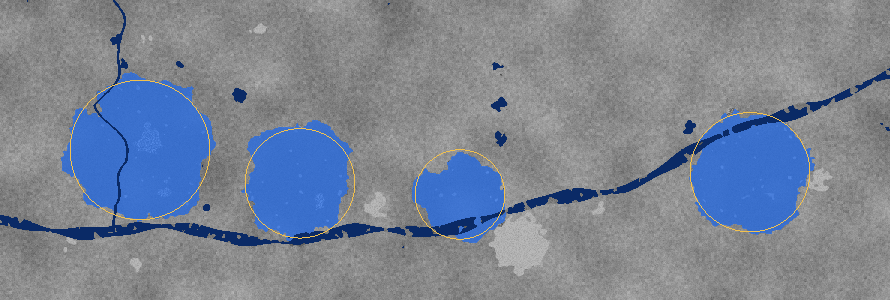
Radar satellites send out microwaves and measure the echo, so they see through cloud and at night, when a flood is usually hidden. Calm water sends the signal away and looks dark. Land and towns send some of it back and look grey or bright. These two scenes are mock images built for the demo in the style of the free Copernicus Sentinel-1 radar, about 100 metres a pixel, shown here at about 200 metres. The frame is about 177 km across and 60 km high. Here the flood is mapped by a fixed image method, set out step by step below, not by a trained AI model. A pilot can swap in a trained model, or ISRO's flood map when one is published.
 BarpetaGuwahatiKamrupMorigaonBrahmaputra
 BarpetaGuwahatiKamrupMorigaonBrahmaputra
 BarpetaGuwahatiKamrupMorigaonBrahmaputra
How the flood was mapped, step by step
- Smooth the grain. Radar images are grainy (speckle). A Lee filter over 5 by 5 pixels evens it out but keeps edges sharp.
- Find the dark-water level. Otsu's method picks the brightness that best splits the during scene into dark and not dark: -14.8 decibels. Darker than that is water.
- Compare before and during. Water during the flood covers 1,965 km². Of that, 320 km² was water before too (the river and wetlands) and is left out. New water must also be at least 3 decibels darker than before, which keeps out fields that are only wetter after rain. That leaves 1,622 km².
- Clean up. Specks are removed, and 18 of 26 patches smaller than 0.5 km² are dropped as noise. Ragged edges are joined, and holes are filled (32.7 km²), so a flooded town whose buildings still shine through counts as flooded.
- The result. 1,641 km² of flooded land. On average it went 10.9 decibels darker. River and wetland next to the flood, within about 800 metres, are added for the insured locations, since homes on river islands flood too (1,704 km² in all).
This is the method flood mapping services commonly use with free radar images. A model trained on past floods can replace it in a pilot. When ISRO publishes a flood map for an event, the page can take that map directly in place of its own, and keep the same overlay, estimate and tracking.
The two radar scenes (mock)
| Scene | Taken | In the archive | Pass | Polarisation | Pixel |
|---|---|---|---|---|---|
| S1-MOCK-20260914-DSC-VV | 14 September 2026, 05:24 | 14 September 2026, 08:11 | Descending | VV | 100 m |
| S1-MOCK-20260926-DSC-VV | 26 September 2026, 05:24 | 26 September 2026, 08:11 | Descending | VV | 100 m |
Times are India time. The scenes are mock, written by the use's own generator from the planted flood (seed 42). Their time to reach the archive is an assumption, close to what the free radar service aims for.
What sits inside the flooded area
Fire and property policies in force when the flood began on 21 September 2026, laid over the mapped flood. 719 insured properties sit in the frame, inside or outside the flood. The flood's start comes from the state's flood report (mock).
By type of property
| Property | Policies | Sum insured | Estimated loss |
|---|---|---|---|
| Factories | 43 | ₹877 cr | ₹48.4 cr |
| Warehouses | 46 | ₹416 cr | ₹28.2 cr |
| Hospitals | 17 | ₹163 cr | ₹7.4 cr |
| Hotels | 21 | ₹156 cr | ₹7.7 cr |
| Houses | 150 | ₹52.3 cr | ₹2.9 cr |
| Offices | 19 | ₹48.7 cr | ₹1.8 cr |
| Shops | 78 | ₹34.5 cr | ₹2.3 cr |
By insurer
| Insurer | Policies | Sum insured | Claims so far | Claimed |
|---|---|---|---|---|
| Insurer E | 27 | ₹201 cr | 7 | ₹13.7 cr |
| Insurer L | 42 | ₹157 cr | 10 | ₹1.6 cr |
| Insurer Q | 24 | ₹147 cr | 8 | ₹2.5 cr |
| Insurer X | 8 | ₹128 cr | 2 | ₹28.9 lakh |
| Insurer Y | 15 | ₹127 cr | 2 | ₹4.4 lakh |
| Insurer F | 26 | ₹124 cr | 4 | ₹13.0 lakh |
| Insurer K | 28 | ₹110 cr | 7 | ₹5.3 cr |
| Insurer H | 18 | ₹94.8 cr | 2 | ₹2.5 cr |
| All 17 others | 186 | ₹659 cr | 60 | ₹31.4 cr |
Insurers shown by alias, not by name.
By district
District detail is for the vertical heads and Data Operations. The Leadership role sees Assam's totals.
Vehicles in the flooded area
| Vehicle | Vehicles | Cover for flood damage | Insured value | Estimated loss |
|---|---|---|---|---|
| Cars | 155 | 120 | ₹11.3 cr | ₹43.7 lakh |
| Taxis and buses | 79 | 52 | ₹8.3 cr | ₹22.0 lakh |
| Goods vehicles | 54 | 37 | ₹7.8 cr | ₹15.2 lakh |
| Two-wheelers | 584 | 332 | ₹4.7 cr | ₹7.9 lakh |
| Other vehicles | 1 | 1 | ₹3.9 lakh | ₹7,858 |
By RTO
RTO-level detail is for the Motor vertical. The Leadership role sees state-level figures.
Motor policies carry only the RTO, not an address. So each vehicle insured in an RTO whose home district is in the flooded area is placed near that district's centre, spread over about 6 km, and counted when it lands in the flood. It is a rough guide. One of the flooded districts has no RTO in the demo data, so vehicles there are not counted. Third-party-only policies do not pay for flood damage to the vehicle, so only cover for own damage enters the estimate. No motor flood claims were built into the test data, so this part is not checked.
The assumptions behind the estimate
The estimate is the sum insured times the chance of a claim times the share of the sum insured a claim takes. These rates are assumptions, set once for the demo and not fitted by any model. They are close to the rates the test data was built with, so a close match with the final claims here checks the flood map and the overlay, not the rates. A pilot would take them from past flood claims.
| Property | Chance of a claim |
|---|---|
| Houses | 40% |
| Shops | 50% |
| Offices | 25% |
| Warehouses | 50% |
| Factories | 40% |
| Hotels | 35% |
| Hospitals | 30% |
A claim takes 8% of the sum insured at the edge of the water, rising to 16% at 5 km or more inside it. Without a height map, distance from the edge stands in for depth.
| Vehicle | Chance of a claim |
|---|---|
| Two-wheelers | 15% |
| Cars | 25% |
| Taxis and buses | 20% |
| Goods vehicles | 15% |
| Other vehicles | 10% |
A vehicle that took in water claims 20% of its insured value, on average.
The largest insured properties in the flood, one row each
This needs row-level records. The Leadership role sees aggregated figures only. Data Operations sees this list, with insurer names.
Claims coming in, against the estimate
Flood claims reported, added up day by day
Amount claimed, added up day by day
Flood claims on property inside the mapped area, by the day they were reported, from the day the flood began to 4 October 2026, the last full week in the data. The estimate line is the first estimate for property. The final line is every flood claim in the test data, including 94 still to be reported after 4 October 2026. Flood claims come in slowly, because surveyors wait for the water to go down.
How we would measure it
Personal data is masked before any person or the AI sees it. The AI flags and drafts. A person decides. Mock data stands in for outside sources that need an agreement.